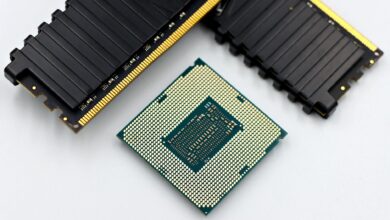
Two Flagship CPUs, One Resolution That Exposes Everything
AMD’s Ryzen 9 9950X3D and Intel’s Core Ultra 9 285K represent the current ceiling of consumer desktop computing, but at 4K rasterization, the gap between them tells a more complicated story than their spec sheets suggest.

The Setup: What 4K Rasterization Actually Tests
At 4K, the GPU becomes the dominant bottleneck in almost every gaming scenario. Frame rates compress, CPU overhead matters less, and the differences between processors narrow considerably compared to what you’d see at 1080p or even 1440p. That compression effect is exactly why testing at 4K is valuable – it filters out noise and forces you to look at architectural efficiency rather than raw clock speed advantage.
The Ryzen 9 9950X3D pairs AMD’s Zen 5 architecture with 3D V-Cache stacking, giving it 128MB of L3 cache across its chiplet design. That cache advantage has historically been the defining factor in AMD’s gaming-oriented X3D lineup, helping CPUs like the 7800X3D and 9800X3D dominate 1080p benchmarks where CPU bottlenecks are most visible. The 9950X3D extends that same principle to a 16-core, 32-thread flagship, which raises an interesting question about whether cache scaling benefits hold at the high-core-count tier.
Intel’s Core Ultra 9 285K runs on the Arrow Lake architecture with 24 cores split across performance and efficiency clusters. It dropped the Hyper-Threading feature that defined Intel’s previous generations, a decision that proved controversial at launch but which Intel positioned as an optimization for its new hybrid core design. At stock settings, the 285K operates with strong single-threaded performance and benefits from Intel’s mature platform with DDR5 memory support and Thunderbolt 5 connectivity.
For this comparison, both CPUs were paired with equivalent high-end discrete GPUs to keep the GPU variable consistent. The goal here is purely CPU influence at 4K – the residual framing where each processor’s architecture still touches frame pacing, minimum frame rates, and 1% low performance even when the GPU is working hardest.

The 4K Benchmarks: Where the Results Land
Across rasterization-heavy titles at 4K, the average frame rate difference between the 9950X3D and the 285K tends to sit within a narrow band. In GPU-bound scenarios – which 4K almost always produces – the margin at average frame rates frequently falls within single digits or statistical noise. A game rendering at 90fps average on the 285K might land at 91 or 93fps on the 9950X3D, which is functionally identical for the player at the monitor.
Where the 9950X3D pulls ahead more reliably is in 1% low frame times. The 3D V-Cache advantage doesn’t vanish at 4K entirely – it shifts. The cache’s benefit in feeding the GPU quickly enough to avoid stalls becomes most visible not in average throughput but in the consistency of frame delivery. In open-world titles with dense geometry and streaming assets – games like Cyberpunk 2077 or Microsoft Flight Simulator at ultra settings – the 9950X3D tends to produce a smoother distribution of frame times, with fewer dips that register as perceptible hitching.
The 285K responds well in titles that lean on multi-threaded CPU workloads alongside GPU rendering. Strategy games, simulation titles, and any game that runs significant AI or physics calculations on the CPU alongside rendering benefit from the 285K’s raw core count and efficient thread scheduling. In those titles at 4K, the Intel chip can match or edge past the 9950X3D precisely because the cache advantage carries less weight when the workload is spread across many cores rather than concentrated in hot cache-friendly loops.
Power consumption is another dimension where the two chips diverge sharply. The 9950X3D runs at a higher TDP under load than many AMD predecessors, but the 285K at full draw in demanding scenarios pulls significantly more wall power. For a workstation-class gaming build where the CPU is also handling rendering, encoding, or compilation tasks alongside gaming, that efficiency gap matters to total system cost over time. The 9950X3D delivers competitive 4K gaming performance while leaving more thermal headroom for sustained workloads.
Pricing positions both chips at the top tier of the consumer market, but their value calculations differ by use case. The 9950X3D commands a premium over AMD’s own 9800X3D and costs more than the 285K at most current retail pricing. If 4K gaming is the primary workload, the extra spend over something like a 9800X3D is difficult to justify purely on frame rate returns. The 285K’s argument at this price tier relies on its platform strengths and workstation performance, not on raw gaming frame rates at this resolution.
The Honest Verdict at This Resolution
At 4K rasterization, neither chip is the obvious choice for a pure gaming build. The GPU is doing the heavy lifting, and spending flagship CPU money on either the 9950X3D or the 285K produces diminishing returns in average frame rates compared to a mid-tier alternative paired with the same GPU. The real differentiation between these two processors shows up in minimum frame rates, consistency under load, and workloads that live outside gaming entirely.

The 9950X3D wins on gaming-specific metrics – particularly frame time consistency and cache-sensitive minimum performance – while the 285K remains the more capable chip for mixed professional and gaming use. Choosing between them at 4K comes down to whether you’re building a gaming machine that occasionally works, or a workstation that occasionally games. That distinction, more than any benchmark number, is what separates the right buyer for each chip.