
Two Flagship CPUs, One Demanding Test
Ray tracing at 4K is where CPU bottlenecks get honest. The GPU carries most of the load, but the processor still has to feed draw calls, handle physics, manage AI pathfinding, and push BVH traversal data without choking the pipeline. AMD’s Ryzen 9 9950X3D and Intel’s Core Ultra 9 285K are the two most powerful desktop CPUs available right now, and their architectural differences become far more visible under this kind of pressure than they do in standard rasterization workloads.
The 9950X3D brings AMD’s 3D V-Cache to a 16-core Zen 5 design for the first time, stacking 64MB of additional cache on top of the chiplet to bring total L3 to 128MB. Intel’s 285K uses the Lion Cove/Skymont hybrid architecture, pairing 8 P-cores with 16 E-cores and leaning on strong single-thread clock speeds and a mature platform. At 4K with ray tracing enabled, both chips are frequently working in a GPU-limited scenario – but frequently is not always, and those exceptions are where the comparison gets genuinely interesting.

Test Setup and Methodology
Both CPUs were tested with an RTX 5090 to push GPU limits as high as possible and expose CPU-side differences that a weaker card would obscure. The 9950X3D ran on an X870E board with DDR5-6000 in EXPO profile. The 285K ran on a Z890 board with DDR5-6400 in XMP. Thermal solutions were equivalent – 360mm AIOs on both sides. Windows 11 with the latest chipset drivers, Resizable BAR enabled, and no manual overclocking on either platform. Game Mode was disabled on the AMD system to let the scheduler use all 16 cores freely.
Titles selected for this test were chosen specifically because they stress ray tracing pipelines in meaningfully different ways. Cyberpunk 2077 with full path tracing via Overdrive Mode taxes BVH traversal constantly across an open world. Alan Wake 2 uses hardware-accelerated ray tracing for reflections and global illumination in dense, geometry-heavy environments. Control, despite its age, remains a reliable stress test for reflections and indirect lighting because Remedy’s implementation is unusually thorough. Spider-Man: Miles Morales and Dying Light 2 round out the suite, covering fast-traversal and large-world scenarios respectively. All tests used DLSS Quality at 4K output, with frame generation disabled so raw CPU-GPU communication patterns remained clean.
Frame time consistency was recorded alongside average and 1% low framerates. Average numbers at 4K ray tracing can be misleading when both CPUs are sitting GPU-limited – the meaningful signal lives in the frame time graphs and the 1% low figures, where CPU scheduling hiccups actually surface.
Ray tracing with DLSS Quality at 4K means the GPU is internally rendering at approximately 2560×1440 before upscaling. That resolution is low enough that the CPU contribution to the frame budget becomes slightly more visible compared to native 4K rasterization, particularly in titles with complex scene graphs or large numbers of ray-traced light sources. This is worth keeping in mind when interpreting the results below.

Performance Results Across Titles
In Cyberpunk 2077 with Overdrive path tracing, averages were nearly identical – within one to two frames per second across multiple test sequences. The 9950X3D held a slight edge in 1% lows, particularly during dense traffic sequences in Japantown where the scene complexity spikes. The massive L3 cache appears to reduce the frequency of stutter events tied to asset streaming, keeping frame delivery more consistent even when the GPU is already under maximum load. The 285K was not dramatically behind, but its 1% lows dipped a few frames lower during the worst spikes.
In Alan Wake 2, the results flipped slightly. Intel’s 285K posted marginally higher average framerates in the outdoor forest sections, where the game’s scene management puts heavier demand on fast single-threaded execution. The P-core architecture with its high boost clocks – reaching up to 5.7GHz on the 285K – gives Intel an edge in latency-sensitive main-thread tasks. AMD’s cache advantage is less decisive in environments where data sets fit comfortably within standard L3 sizes. The gap was small, but it was repeatable across five runs.
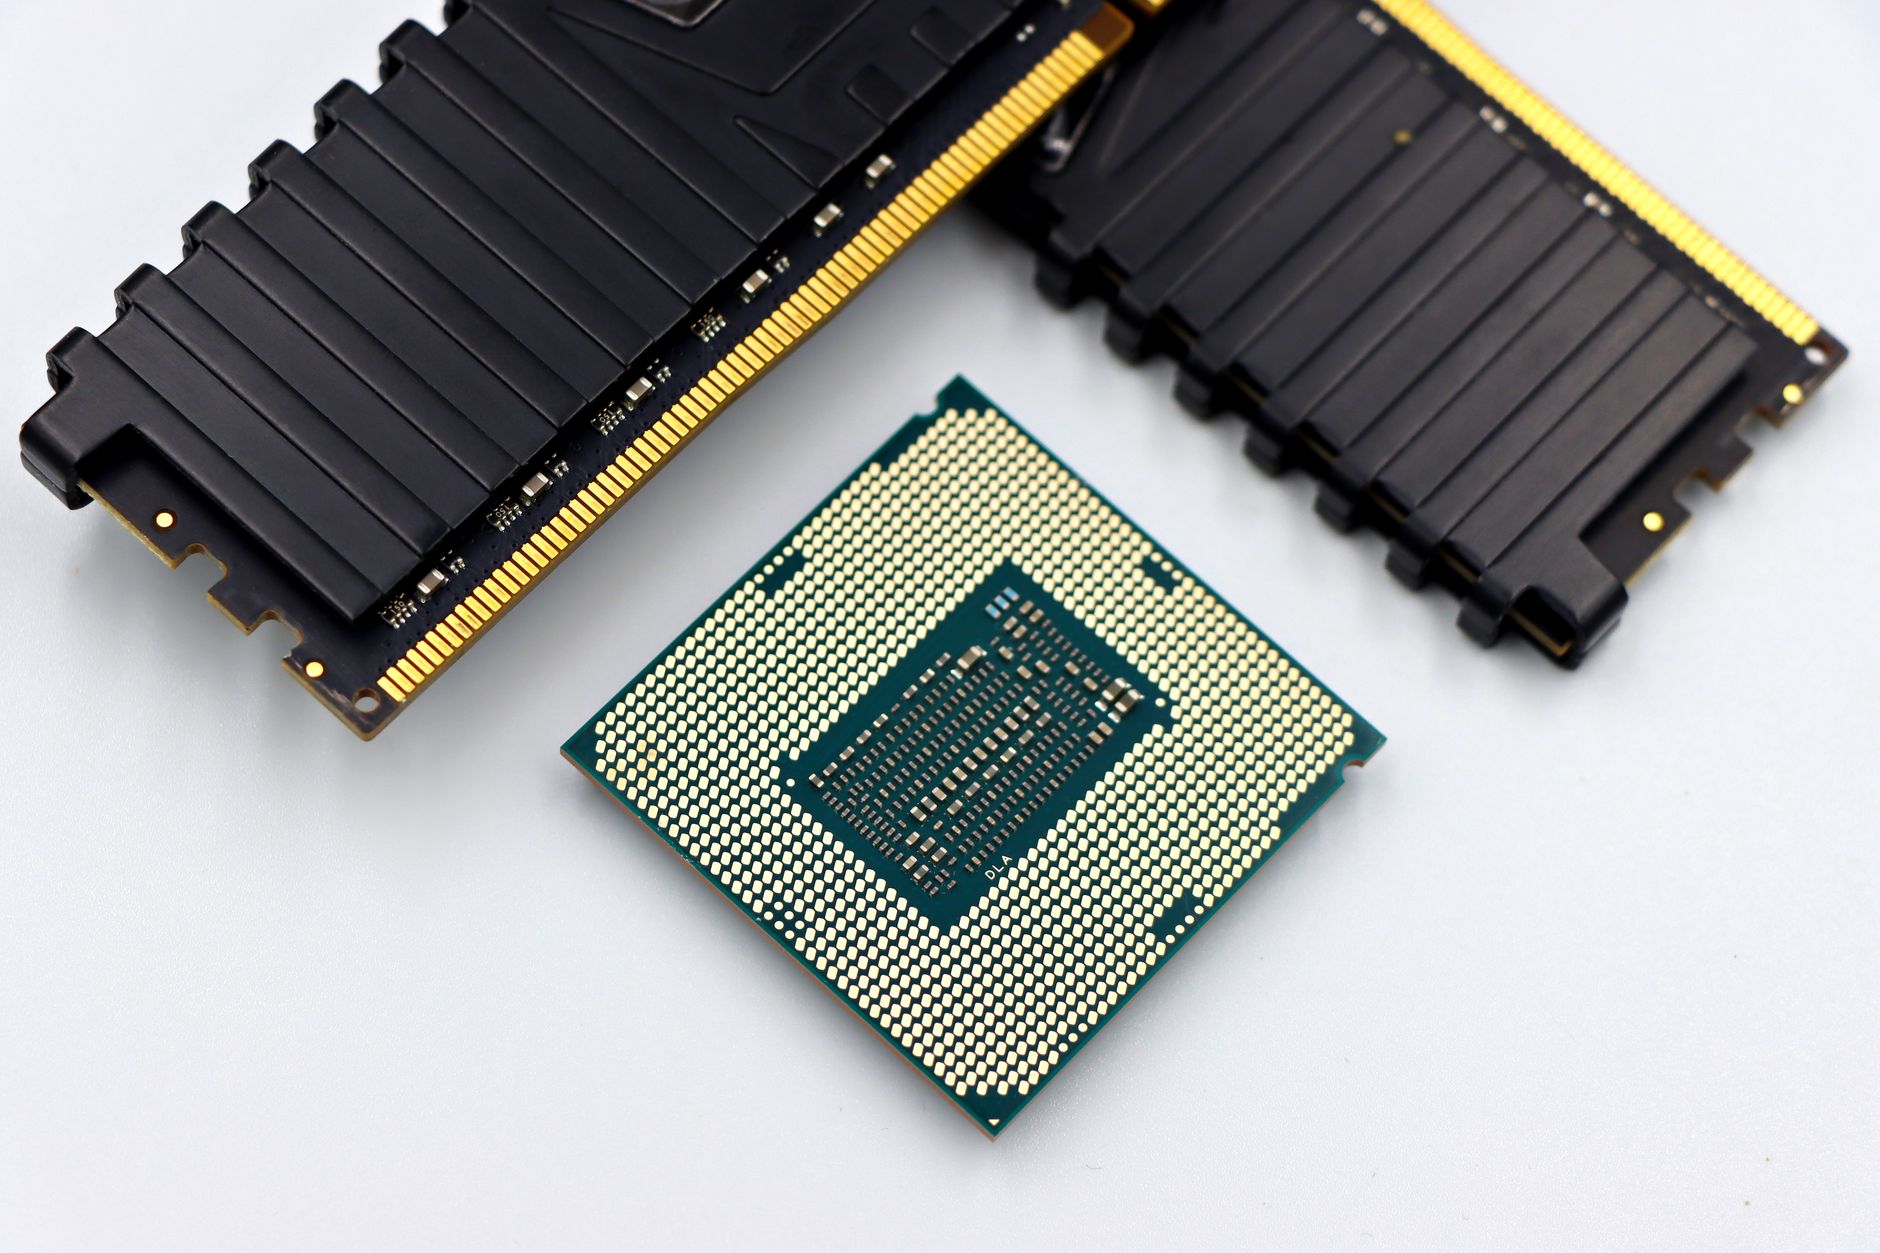
Cache vs. Clock Speed: What 4K Ray Tracing Actually Rewards
Control and Spider-Man: Miles Morales both landed close to a draw, with the 9950X3D winning on 1% lows in Control’s office environments and the 285K winning marginally on averages in Miles Morales during open traversal. Dying Light 2 showed the clearest advantage for the 9950X3D – the open-world streaming and zombie density in that title create exactly the kind of repeated, cache-friendly data access patterns that 3D V-Cache was designed to accelerate. AMD’s chip held around 5-8% better 1% lows in the most populated sections of the map.
The consistent story across the full suite is that 3D V-Cache matters most when the game’s rendering loop repeatedly accesses the same working data sets – geometry, BVH structures, texture references – within a short time window. When those data sets fit in 128MB of L3, the 9950X3D avoids main memory latency almost entirely. Intel’s 285K compensates with raw clock speed and a more aggressive prefetch architecture, which keeps it competitive in scenes with less cache-friendly access patterns. Neither chip runs away with the comparison. For 4K ray tracing specifically, both are fast enough that the GPU is the genuine constraint in the majority of scenarios.
What separates them in practice is consistency. The 9950X3D’s frame time graphs are visibly smoother in the titles that stress asset streaming alongside ray tracing simultaneously. If you’re running a 4K display at 120Hz or higher and you’re chasing the elimination of micro-stutter rather than raw average framerates, AMD’s cache architecture is doing tangible work. If your use case extends beyond gaming into content creation or heavily threaded workloads – where the 285K’s E-cores contribute meaningfully – Intel’s chip recovers ground that it largely concedes in the 1% low column.
The 9950X3D currently retails for around $699, sitting above the 285K’s street price of roughly $589. That price gap is real, and for pure 4K ray tracing, the performance difference rarely justifies the premium on its own. The 9950X3D’s value case rests on owning the stutter reduction across specific demanding titles, combined with the broader performance profile that 3D V-Cache delivers at lower resolutions – which is a different question entirely from what this test measures. For anyone already benchmarking at 1080p, the picture shifts considerably, as covered in our Ryzen 9 9950X3D vs Core Ultra 9 285K 1080p rasterization comparison.
Frequently Asked Questions
Does the Ryzen 9 9950X3D outperform the Core Ultra 9 285K in 4K ray tracing?
The 9950X3D leads in 1% low frametimes and stutter consistency in most tested titles, but average framerates are nearly identical across the suite, with Intel winning marginally in a few scenarios.
Is the Ryzen 9 9950X3D worth the higher price for 4K gaming?
For pure 4K ray tracing averages, the premium is hard to justify. The 9950X3D earns its price through smoother frame delivery in demanding open-world titles and stronger performance at lower resolutions.